Net Worth
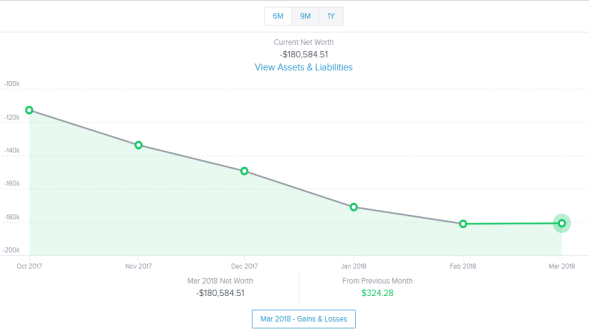
The Net Worth widget tracks the net sum of all your assets and liabilities over the past year. The dots on the graph represent your net worth for each month, while the lines on the graph represent the change in your month-to-month net worth.
Note: When you first use Net Worth, it may not accurately represent your spending history. Accuracy improves over time as sufficient history is built up and additional external accounts are linked.
Using the Net Worth Widget
- Adjust the time frame by choosing a date range from the tabs above.
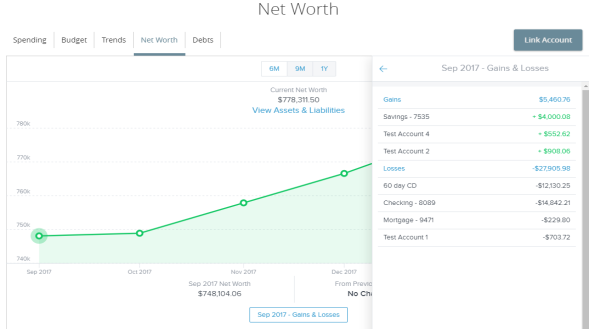
- Double click a circle on the line chart to see your net worth's gains and losses. A window appears showing the amount of change that occurred within each of your accounts during that month.
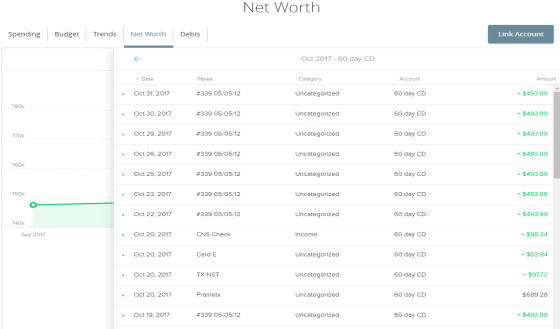
- Click one of the accounts to display the associated transactions.