Trends
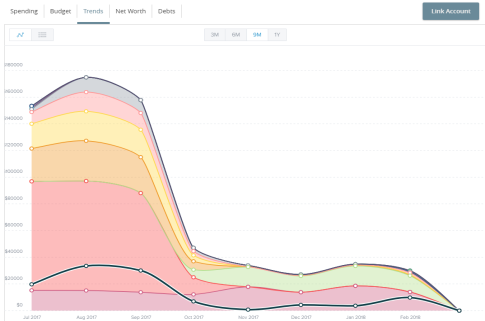
The Trends widget builds even further on your budgeting categories to help track spending over time as compared to income. It shows spending history by category, in relation to income. This way, you can quickly determine if you are spending more than you are making.
Using the Trends widget
- You can view transaction trends graphically or in list view. Choose from the date ranges tab at the top to change the transaction trends period.
- Hover your mouse over a colored area to show the actual spending in each category for the months displayed.
- Click a category area in the graph to drill down into the selected category and show any relevant subcategories.
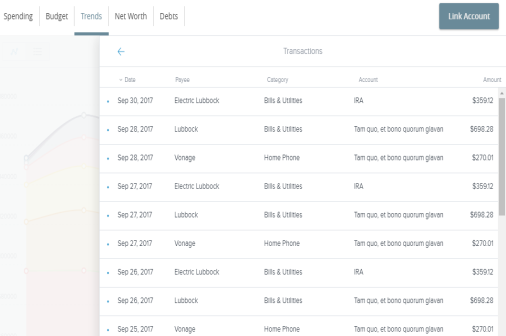
- Click any of the circle data points to display a list of transactions for the selected category.
- Click on any monthly transaction total to see transaction details.