Trends
The Trends tool builds even further on your budgeting categories to help track spending over time as compared to income. It shows spending history by category, in relation to income. This way, you can quickly determine if you are spending more than you earn.
Using the Trends tool
-
You can view transaction trends graphically or in list view.
Choose a date range at the top to change the transaction trends period.
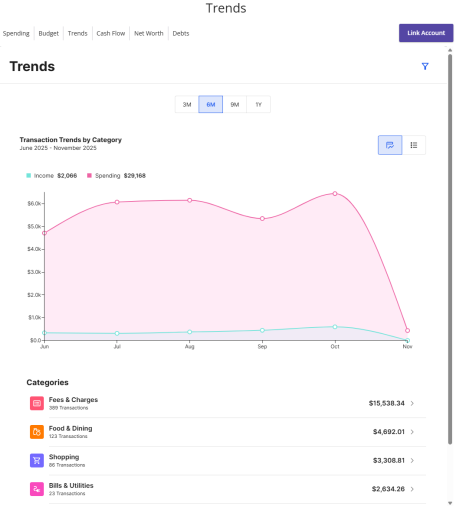
- Hover your mouse over a circle data point to show the actual spending and income for the selected month.
- Select the list view
 icon and select a category to drill down into it and show any relevant subcategories.
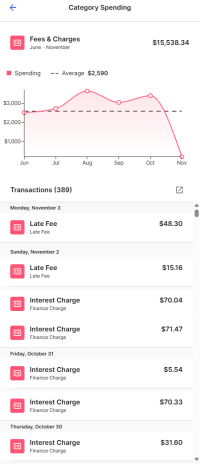
- Select any of the categories to display the spending and a list of transactions for the selected category.
- Hover your mouse over a circle data point in the Category Spending section to show each month's spending totals.
- Select any transaction to see transaction details.
Note: Tags only appear within Financial Tools. They do not appear on the Account Details page and are not used for anything within digital banking at this time.
- Select the list view
 icon to view all categories as a list.
Note: Categories display in chart view by default.
icon to view all categories as a list.
Note: Categories display in chart view by default.
Note:
Your financial institution (FI) has a choice of two providers for
Personal Financial Management: MX or Geezeo.
This feature is only available to users with
MX Personal Financial Management.
To learn more, see
Determining your Personal Financial Management provider
.
Note: Your experience may be different from the user interface described, based on your financial institution's custom configuration.