Campaign reports
Use campaign reports to quickly monitor the effectiveness of your campaign based on a variety of metrics. You can access campaign reports by selecting the More icon ( ) for a campaign on the Campaigns page.
Campaign reports contain data for the following areas:
- Impressions—the number of unique times ads in the campaign were displayed to users.
- Clicks—the number of times users clicked on an ad in the campaign.
- Clickthrough rate (CTR)—the percentage of viewers who clicked on an ad in the campaign.
- Conversions—the number of users who adopted the targeted product or used the targeted feature during the time frame of the campaign
Each campaign report contains a graph that updates dynamically as you select the various information cards at the top of the page. While the information cards contain a high-level overview of impressions, clicks, CTR, and conversions, the graph allows you to drill deeper into the data.
The x-axis of the graph contains the date range, and the y-axis of the graph contains a numeric value or percentage, depending on which metric you view.
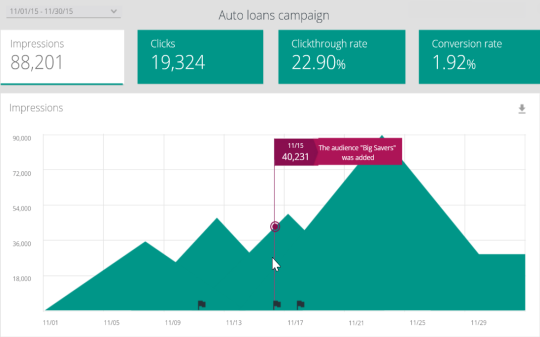
 ) on a campaign indicates a change occurred. If multiple changes occurred on the same day, a number appears next to a flag. Hover over a flag to see details about the change(s).